It has now been more than six weeks since I have last been to the office. 48 days to be exact. Like everyone else on this planet, I spent the majority of the last few weeks in the confines of my own four walls – with the occasional trip to the supermarket down the road.
Instead of writing yet another “Here are 8 tips to stay productive at home” article, giving you an update on my sourdough skills (hint: good), or my progress with Animal Crossing (hint: not so good), I thought I’d spend some time looking at my Quantified Self data and write up a Quarantine QS Report instead.
The graphs and statistics in this article look at the ten weeks between February 5, 2020 and April 13, 2020. They compare the first five weeks of quarantine with the five weeks before the lockdown.
If you have feedback or questions on anything in this report, give me a shout.
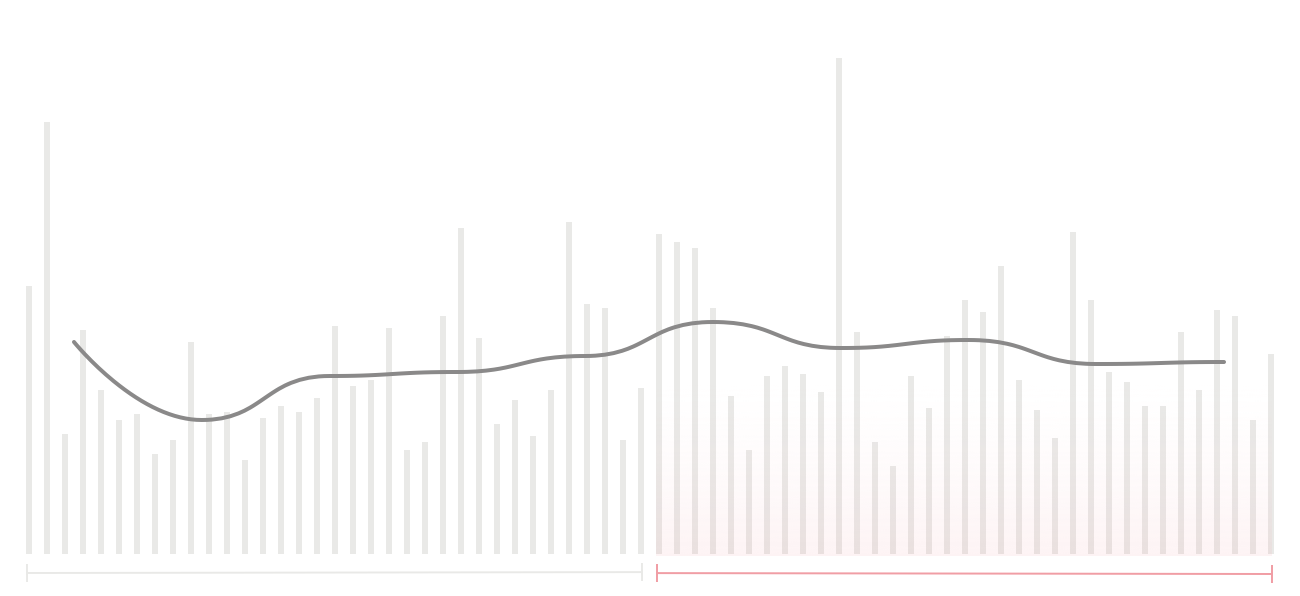
The good news first: So far, the quarantine hasn’t had any negative impact on my mental wellbeing. My reported daily happiness levels have on average remained almost the same (Average: 3.86 → 3.89).

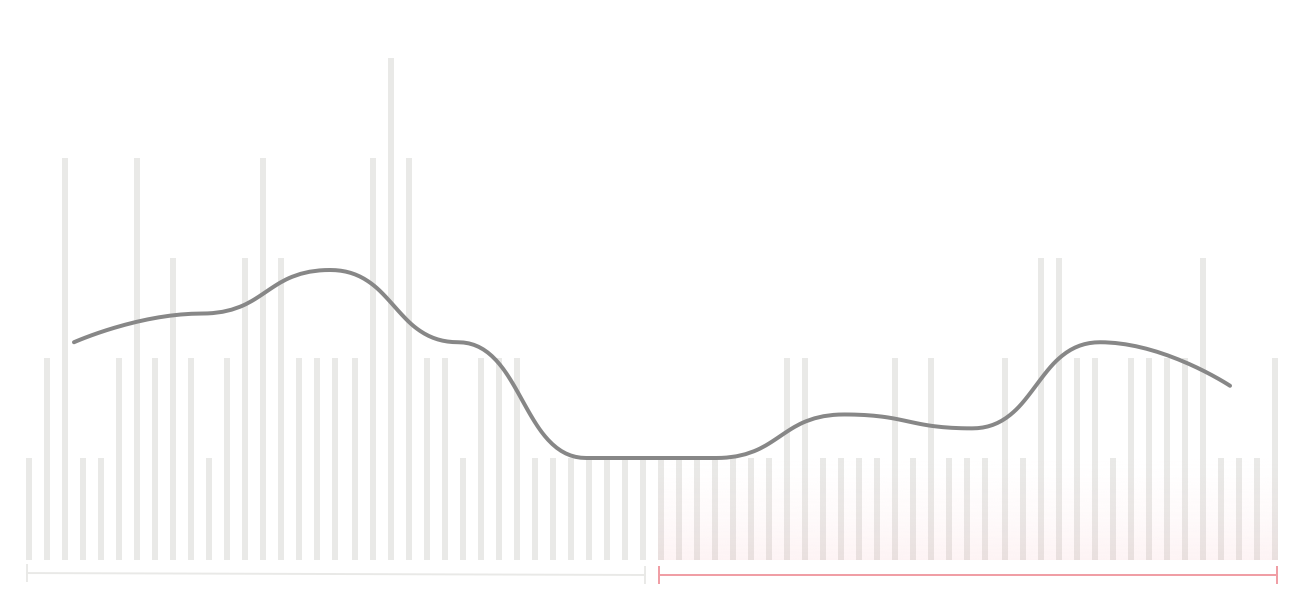
My stress levels have decreased by almost 30% since the start of the lockdown (Average: 2.11 → 1.51). I assume that this is due to less in-person meetings.
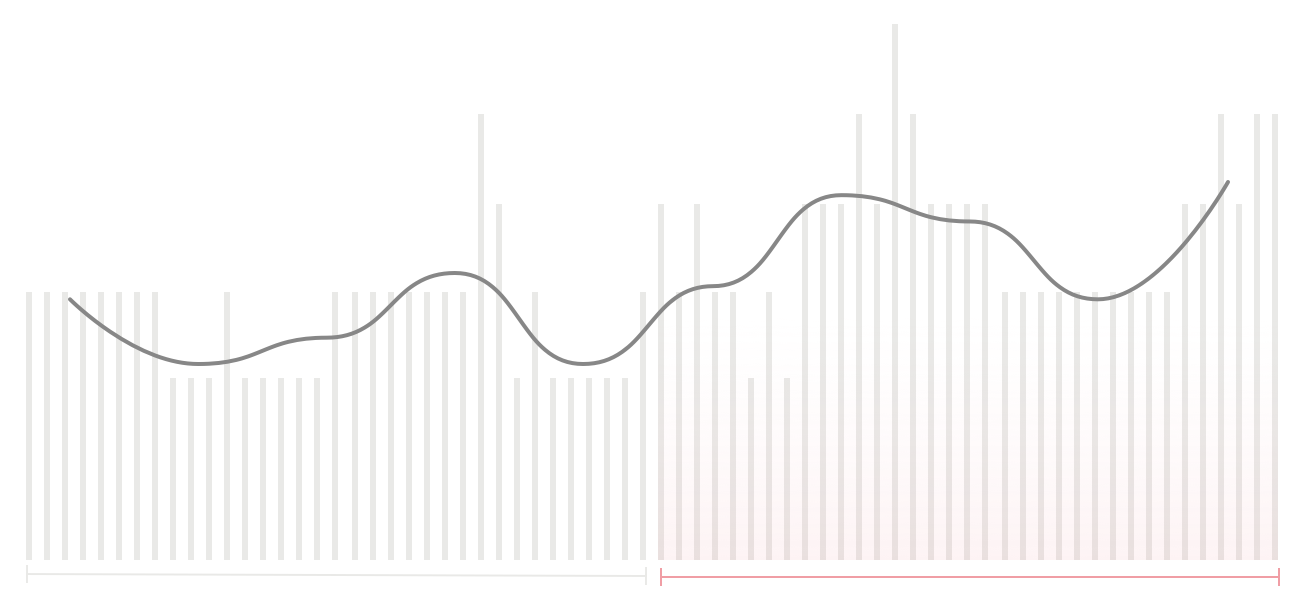
While the lockdown didn’t impact my mental wellbeing, it has had a severe impact on my physical wellbeing. My perceived backpain has increased by more than 37% in the last few weeks (Average: 2.69 → 3.69).
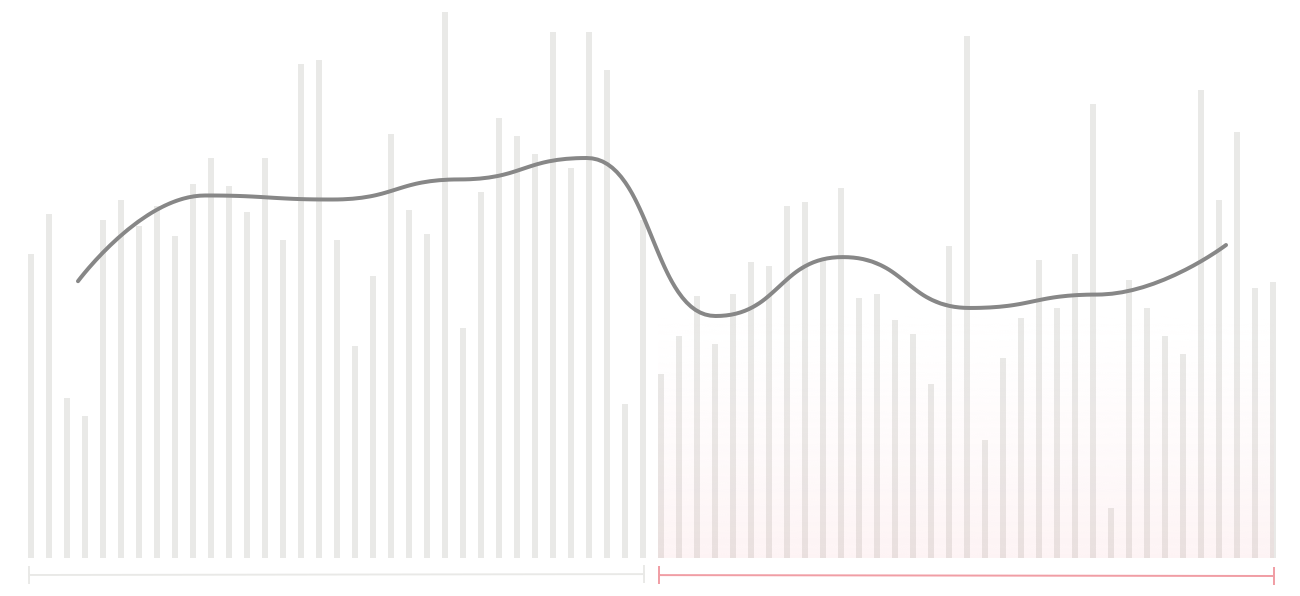
This is partly due to the lack of a proper desk setup at home – but probably also driven by less physical activity overall. My Fitbit reports a 22% decline in the average amount of steps since the start of quarantine (Daily Average: 10,964 → 8,510).
Even more importantly, covid-19 has killed my 180 weeks swimming streak. I can’t wait until swimming pools are allowed to open again.

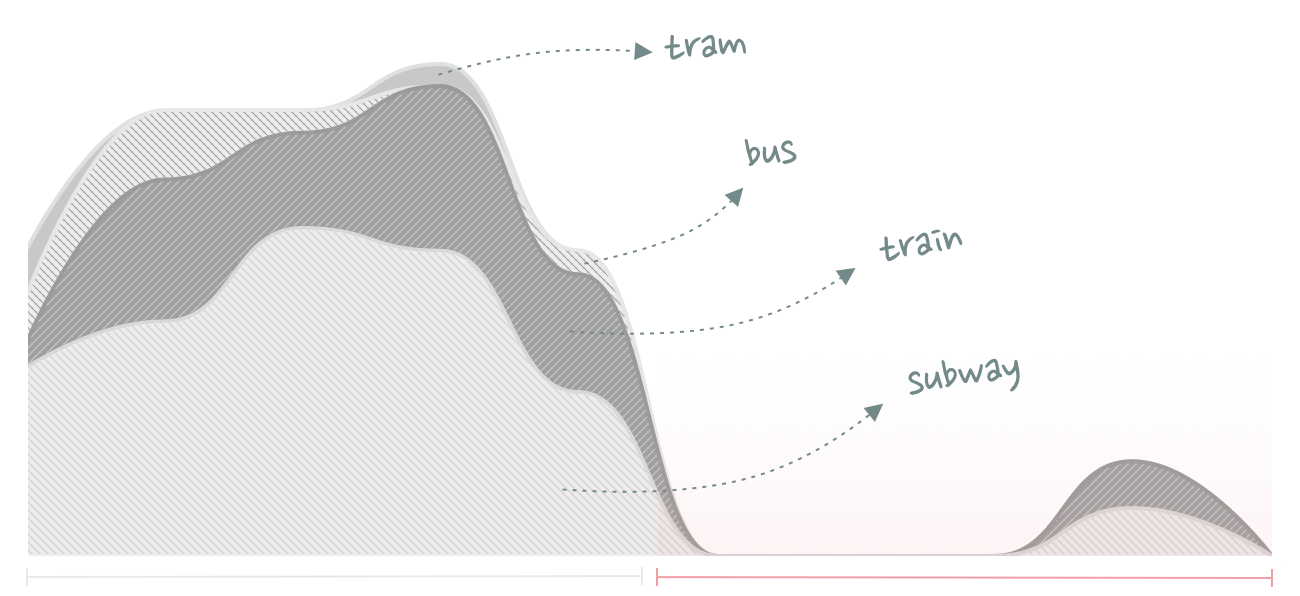
Walking and swimming aren’t the only modes of transport impacted by the lockdown – my public transport consumption has also come to an almost complete halt (with the exception of a doctor visit that required it).
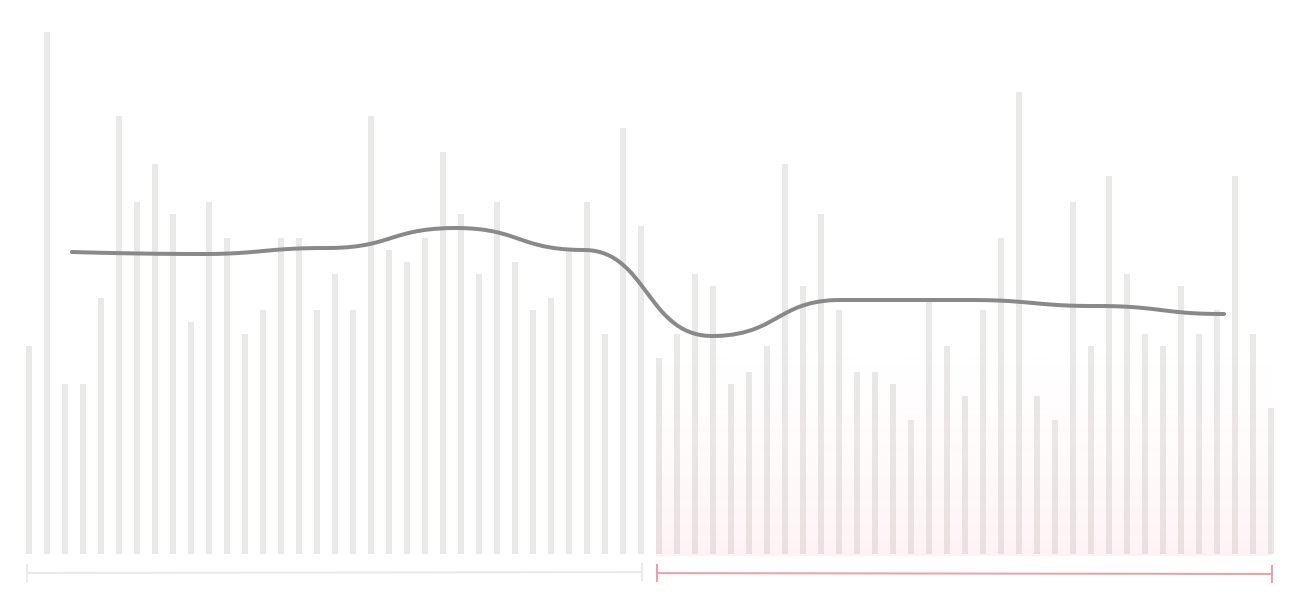
A positive side effect of spending more time at home is being exposed to less air pollution. The average AQI level of my first five weeks of quarantine was 21% lower than the average of the previous five weeks when things were still normal (Average AQI: 25.26 → 19.91).
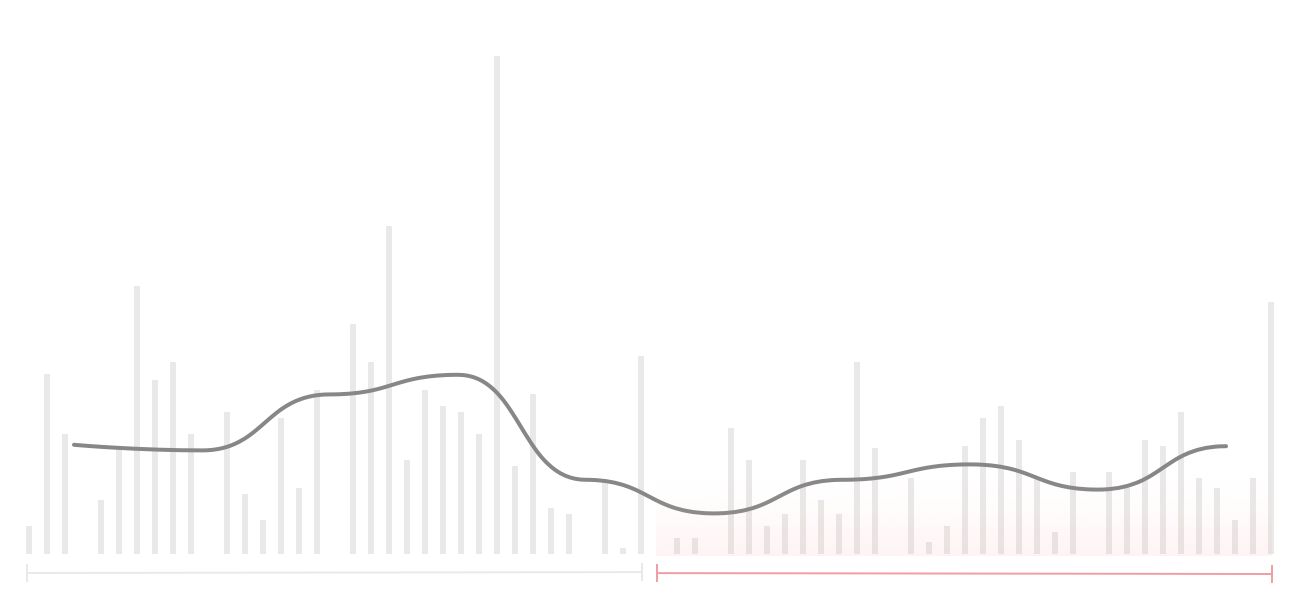
Another positive side effect has been the additional time I get to spend reading. My book consumption has quadruplet since the start of the lockdown (Average Daily Reading Time: 15min → 77min).
.
Audio-based forms of media consumption, on the other hand, have seen a decline. My podcast listening time has gone down by almost 40% (Average Daily Listening Time: 23min → 14min).

My music consumption has also decreased by 40% (Average Daily Number of Songs: 23 → 14).
Since I don’t have a coffee machine at home, the number of espresso-based drinks I’ve been consuming has gone down dramatically. Instead, I finally get to use my Chemex and Aeropress more often – resulting in a 231% increase in filter coffee consumption.

Apart from the occasional pizza I pick-up at the Italian place in the neighborhood, my food consumption has also almost completely shifted to home-made meals.

Relatedly, my number of Swarm check-ins has also decreased by 56%.
Being confined to my own home has resulted in more phone screen time (especially social media apps). I now spend an average 151 minutes per day looking at my phone, compared to 131 minutes before the lockdown – a 15% increase.
