This is my quantified self report for 2018. Since 2013 I’ve been tracking various life metrics to learn more about myself and improve my productivity, health and well-being. Last year I kept track of about 50 metrics across 5 categories. Some data are captured automatically via applications such as Last.fm (music), Fitbit (steps, sleep), RescueTime (productivity) or Moves (location) – I log the rest manually in a Google Sheets spreadsheet.
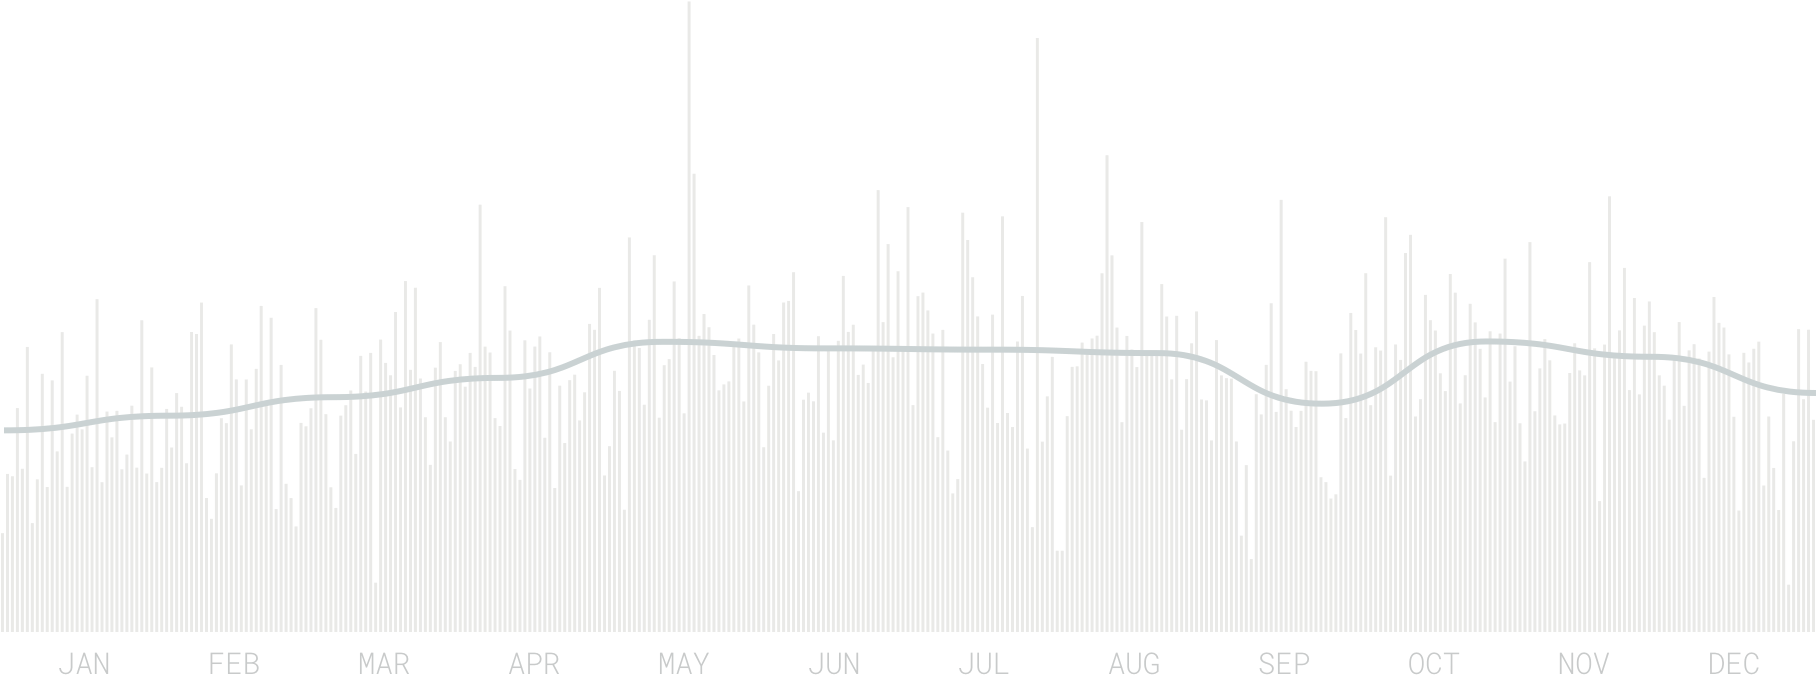
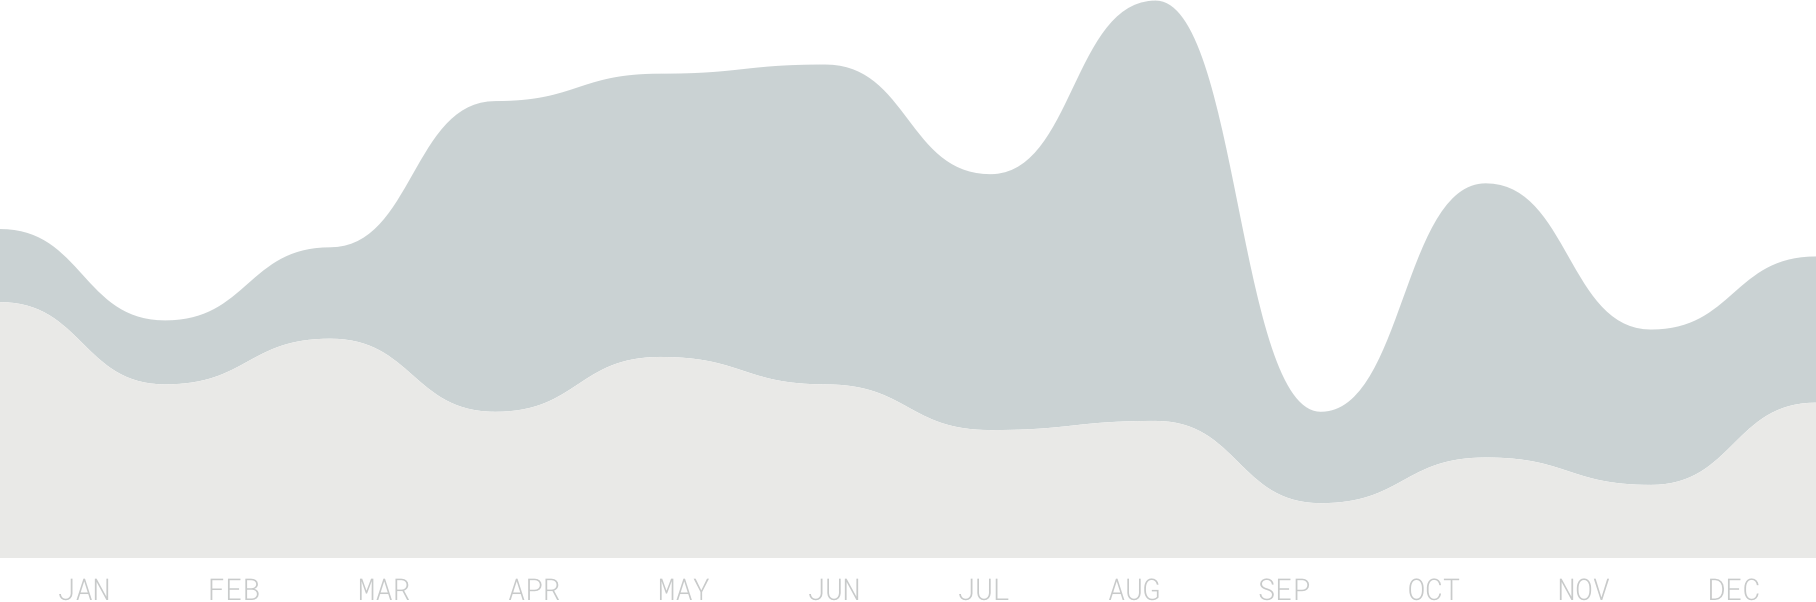
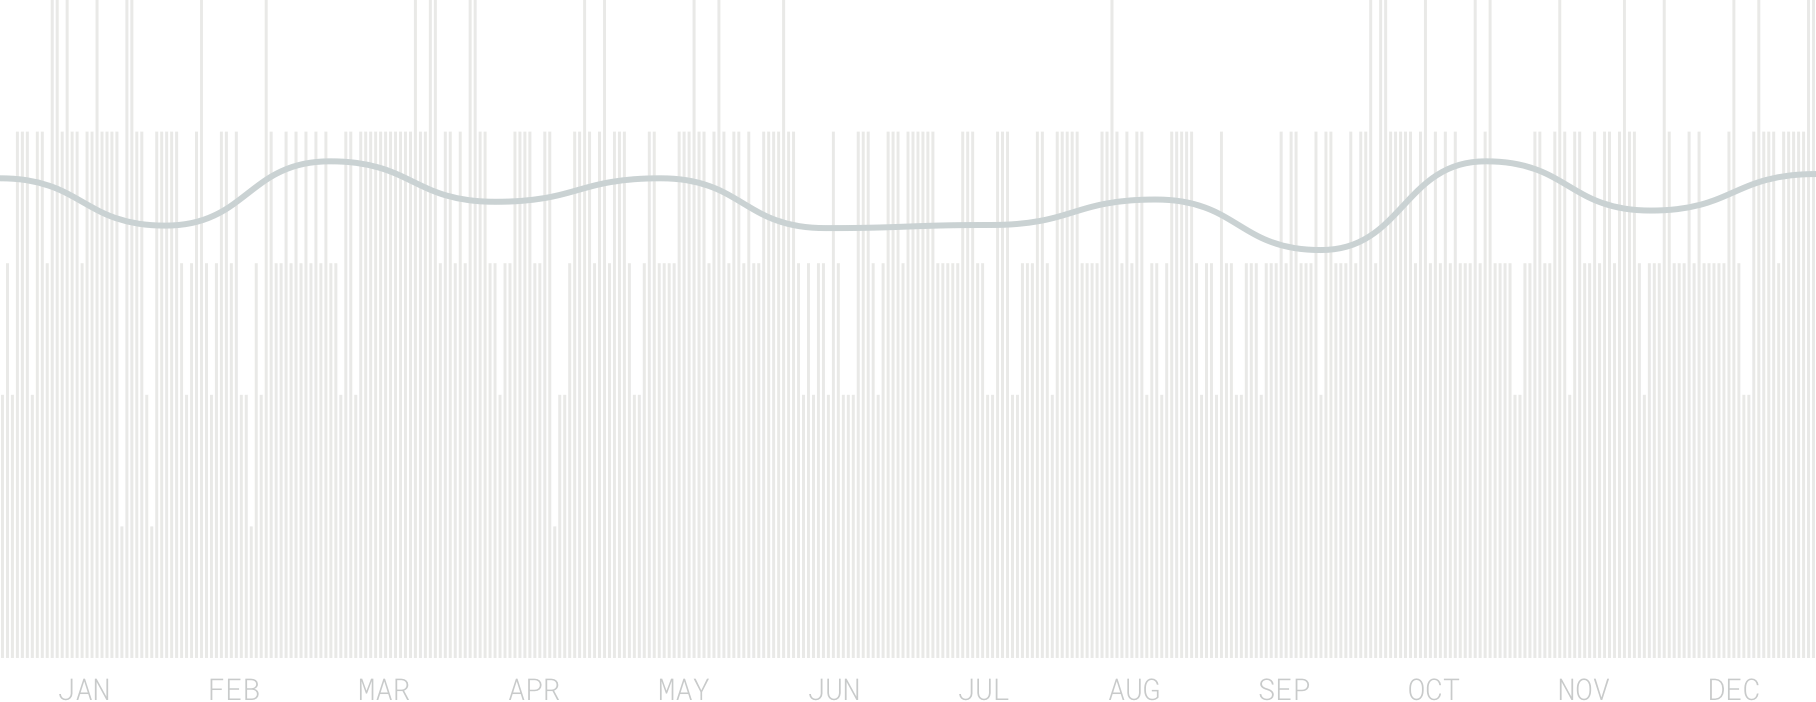
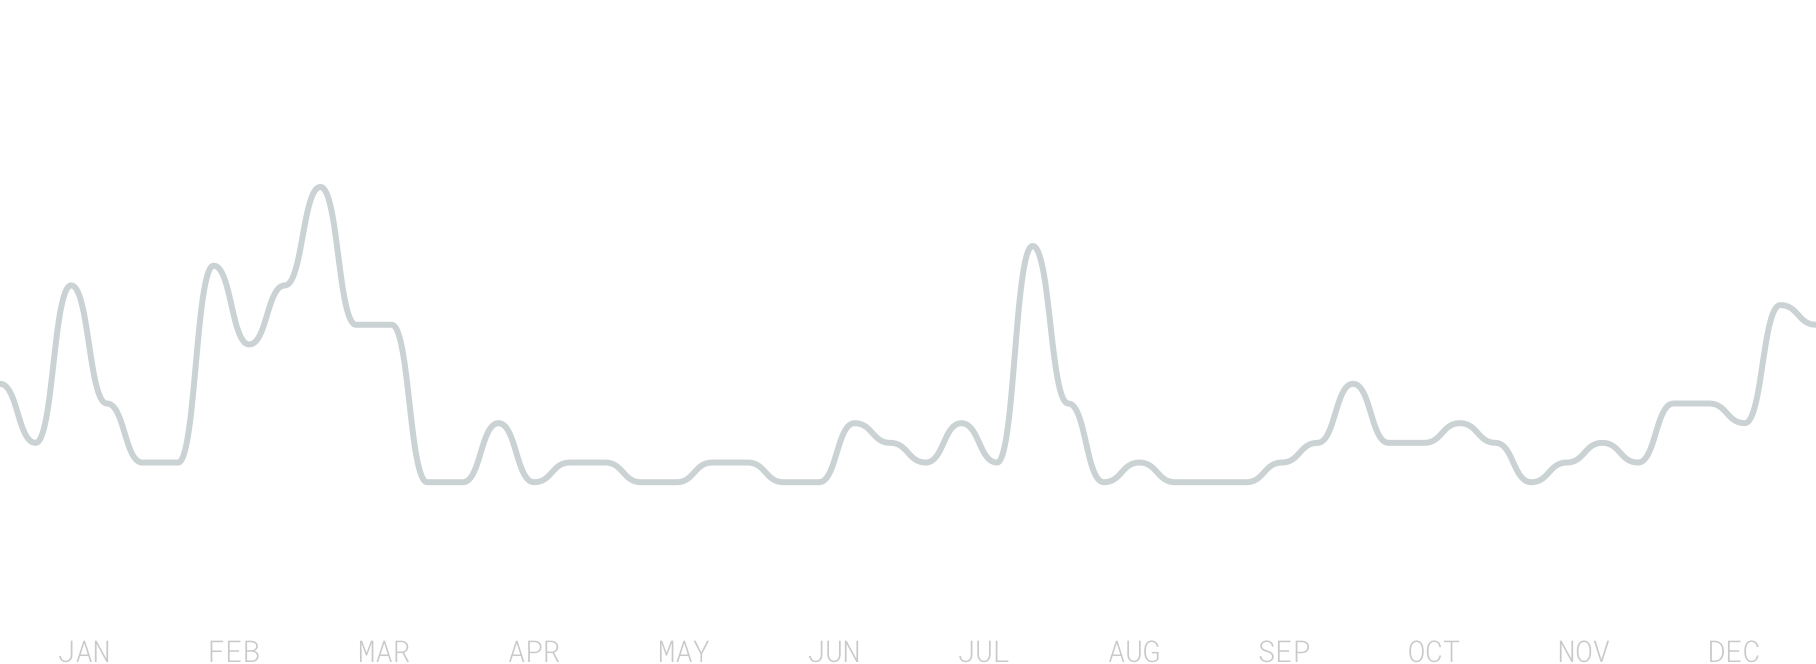
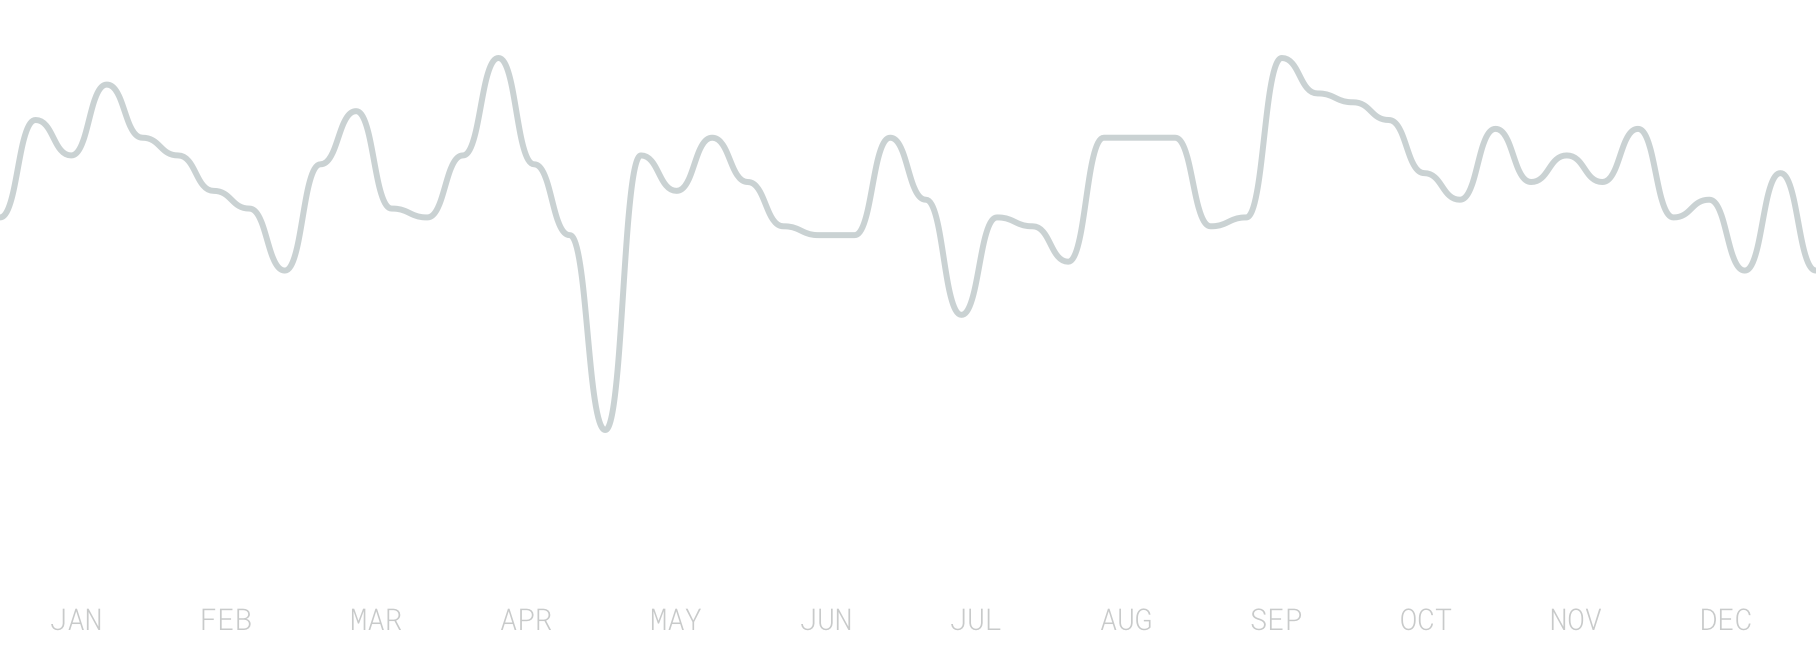
I took a total of 4,477,138 steps last year, which is an average of 12,226 steps per day. My most active day was May 19 with 30,147 steps. On 88 days I didn’t hit my daily step goal of 10,000. I walked less than average in colder months of the year (Jan-Apr, Dec). You can also see a dip in September where I was down with the flu for about a week.
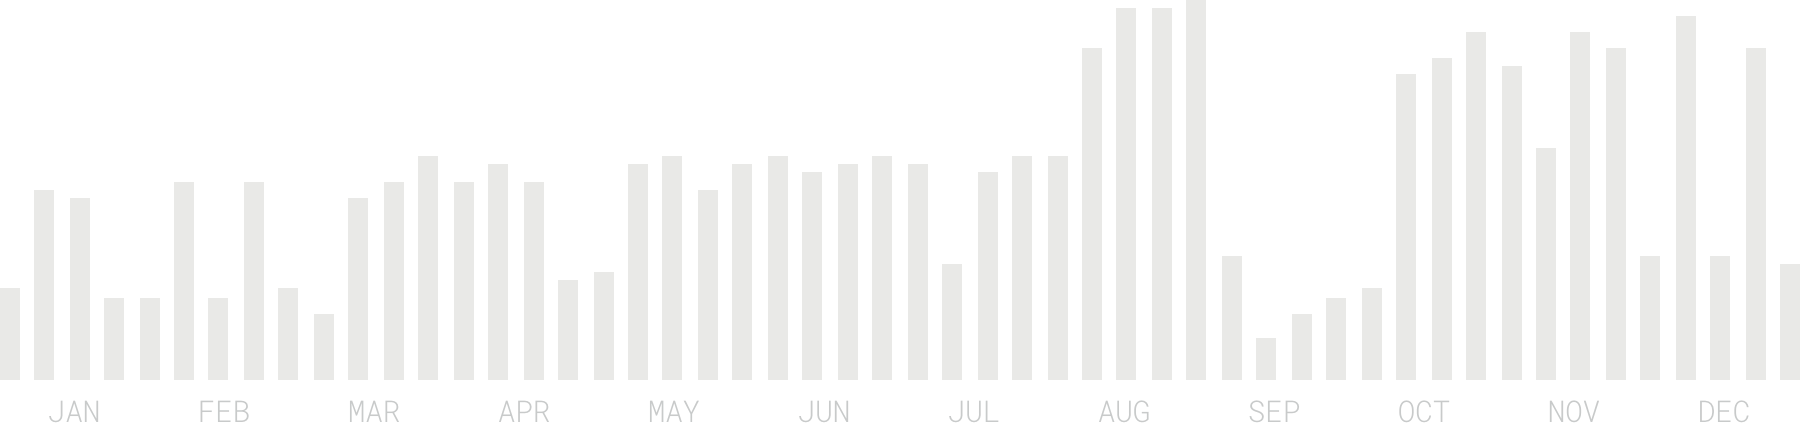
My 2018 goals included going for a swim at least once per week and increasing the total swim distance. I didn’t miss a single week in 2018 and I swam a total of 128.5 kilometers which is a 27% increase compared to 2017. I swam in 6 different pools and 1 lake across 6 different cities in 4 different countries. The London Acquatics Centre was the nicest pool I swam in this year.
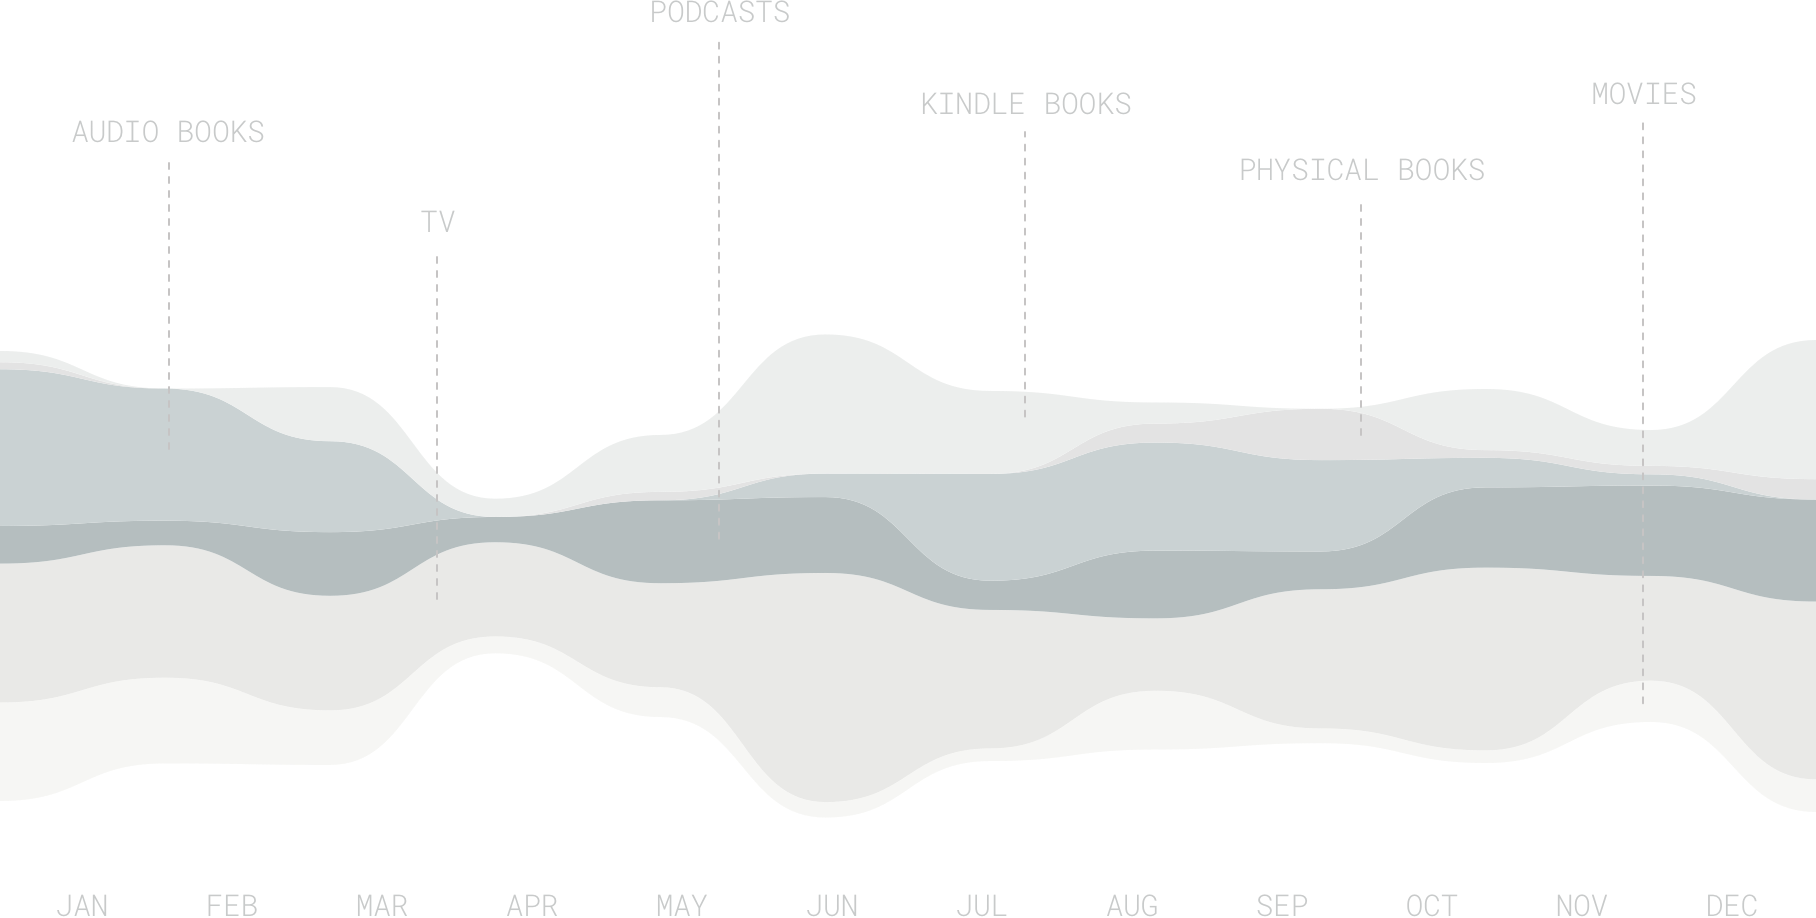
I consumed a total of 30 books last year of which I finished 18 (60% completion rate). I read 11 books on my Kindle (55% completed), 6 in paper format (33% completed) and listened to 13 as audiobooks (77% completed).
I spent 73.5 hours reading books on my Kindle, 14.5 hours reading paper books and 89 hours listening to audiobooks. That an average of roughly 29 minutes of book consumption per day.
My favourite books this year were The Elephant in the Brain, Finite and Infinite Games and Bad Blood.
Listening to 84 podcast episodes took up 85 hours of time last year, while watching TV and movies made up 193 and 56 hours, respectively.
Additionally, I read 361 long-form articles.
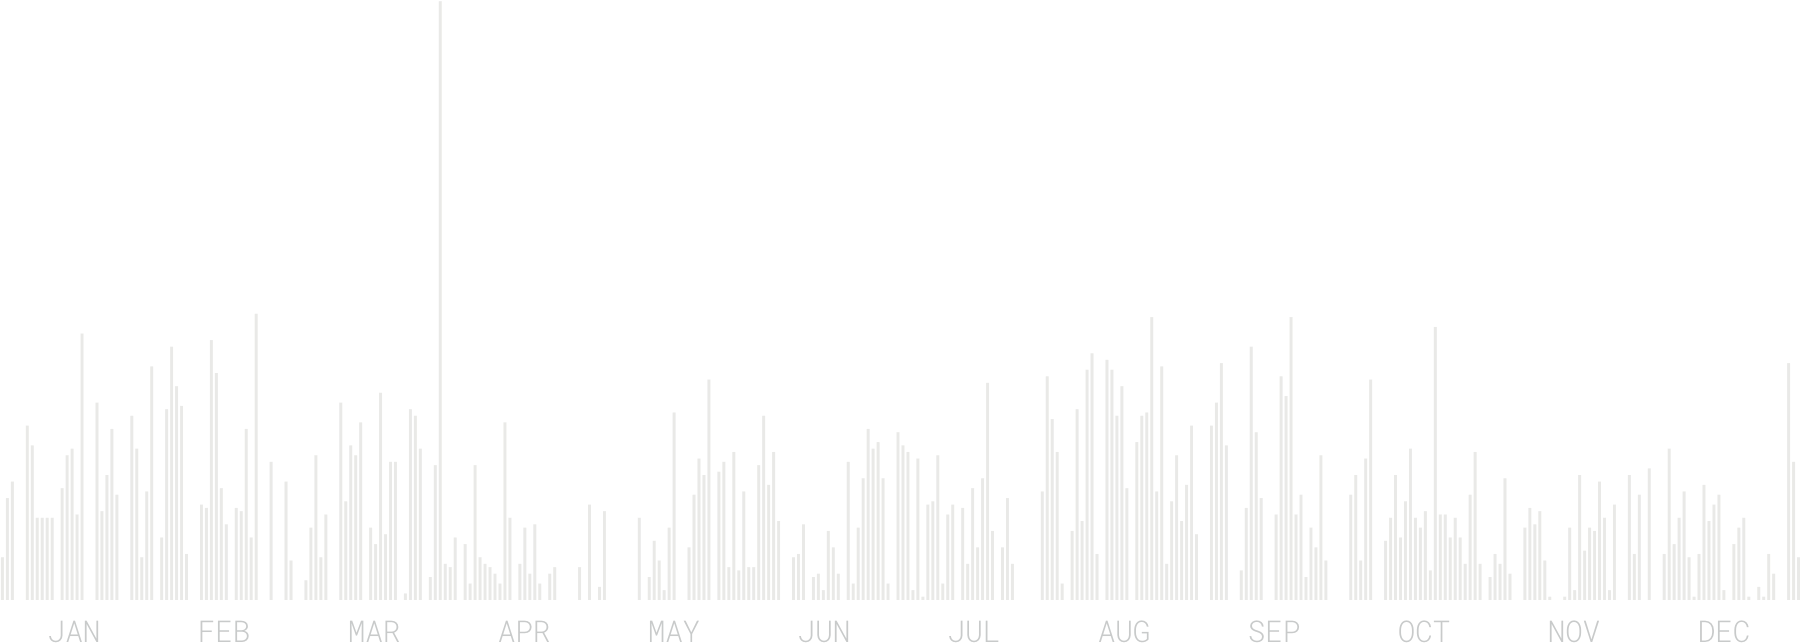
I spent 21 days and 10 hours listening to 8.820 songs (of which 3.334 were unique) from 1491 different albums by 930 different artists.
I haven’t consumed this much music since 2013 (9403 songs), which is a positive sign since I suspect that music consumption is a good proxy for productivity (my job between 2014-2017 was quite meeting-heavy).
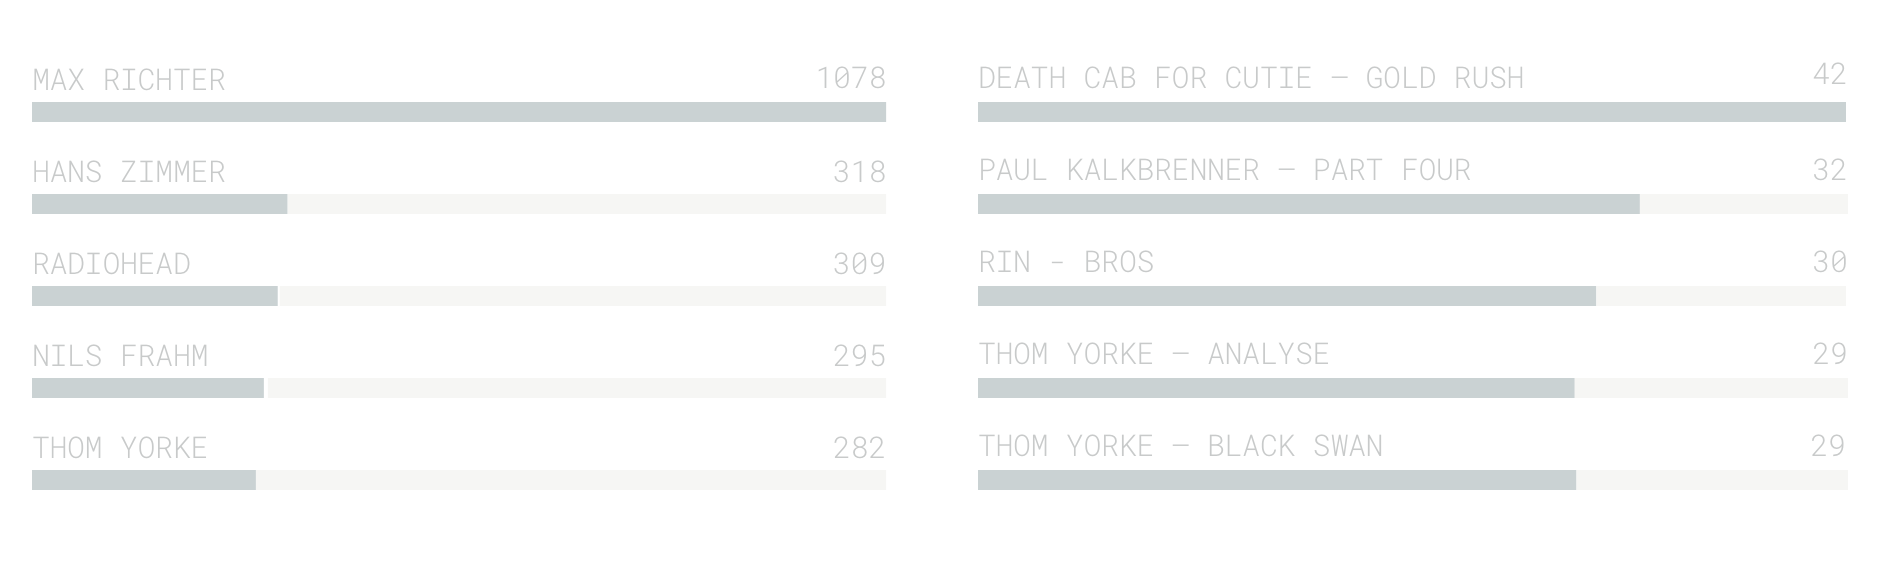
More than 60% of the songs I listened to last year were electronic, ambient or contemporary classical music (ideal for productive work). I listen to most music on Fridays (a day that usually has less meetings).
Exactly half of the music I consumed were songs I listened to for the first time.
I traveled 12,626 kilometers last year visiting 15 cities in 5 countries (DE, AT, CH, PL, GB). I spent the vast majority (+90%) of my time in Berlin:

Yellow: Walking / Red: Public Transport, Car, Taxi
I visited roughly 5 places per day (down 7% YoY) and explored 633 new locations that I hadn’t been to before.
Dark gray: Filter / Light gray: Espresso
I had 471 cups of coffee last year. 58% of which were filter-, 42% espresso-based.
I drank 113.85 liters of beer last year (which is less than I drank in 2017, but still above the average per capita consumption in Germany).

Left: Soccer Games (in min) / Right: Average temperature (in °C)
I compared the data to the time I spent watching soccer and the average temperature, which are the two factors I assume have the highest influence on my beer drinking behavior.
As if the number of beers wasn’t concerning enough, I additionally had 43 Old Fashioned’s and 101 glasses of wine. (I decided to cut down my alcohol consumption this year.)
I ate 12 bowls of Ramen, 15 Burgers, 14 Gemüsekebabs, 7 Bibimbaps, 2 Poke Bowls, 4 Schnitzels, 78 slices of Pizza and 82 dishes of Pasta.
I limited my meat consumption to 24 meals, but had fish or seafood on 83 occasions.
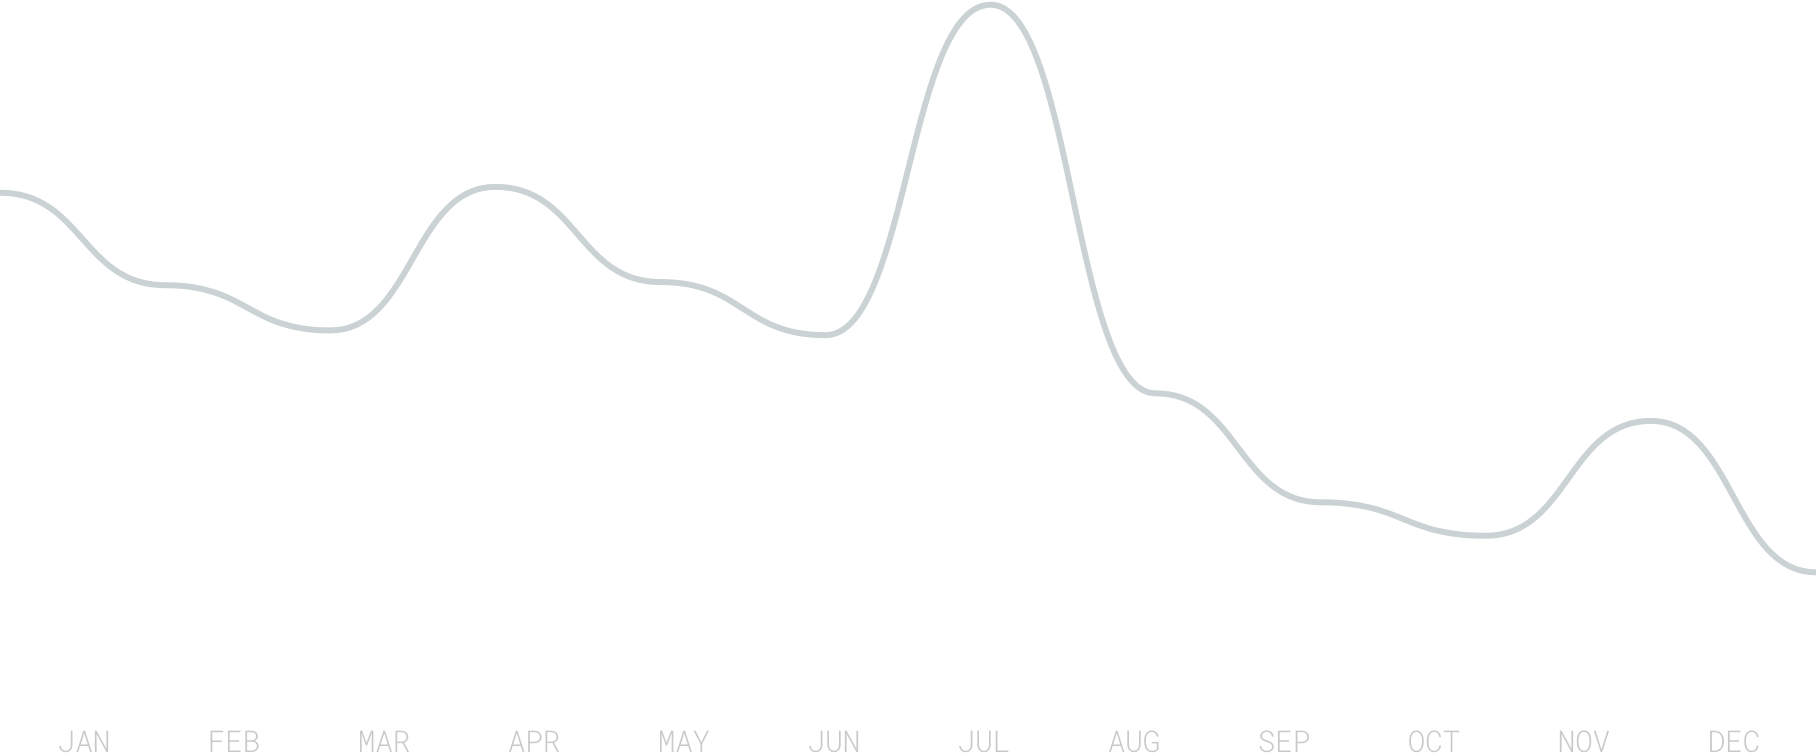
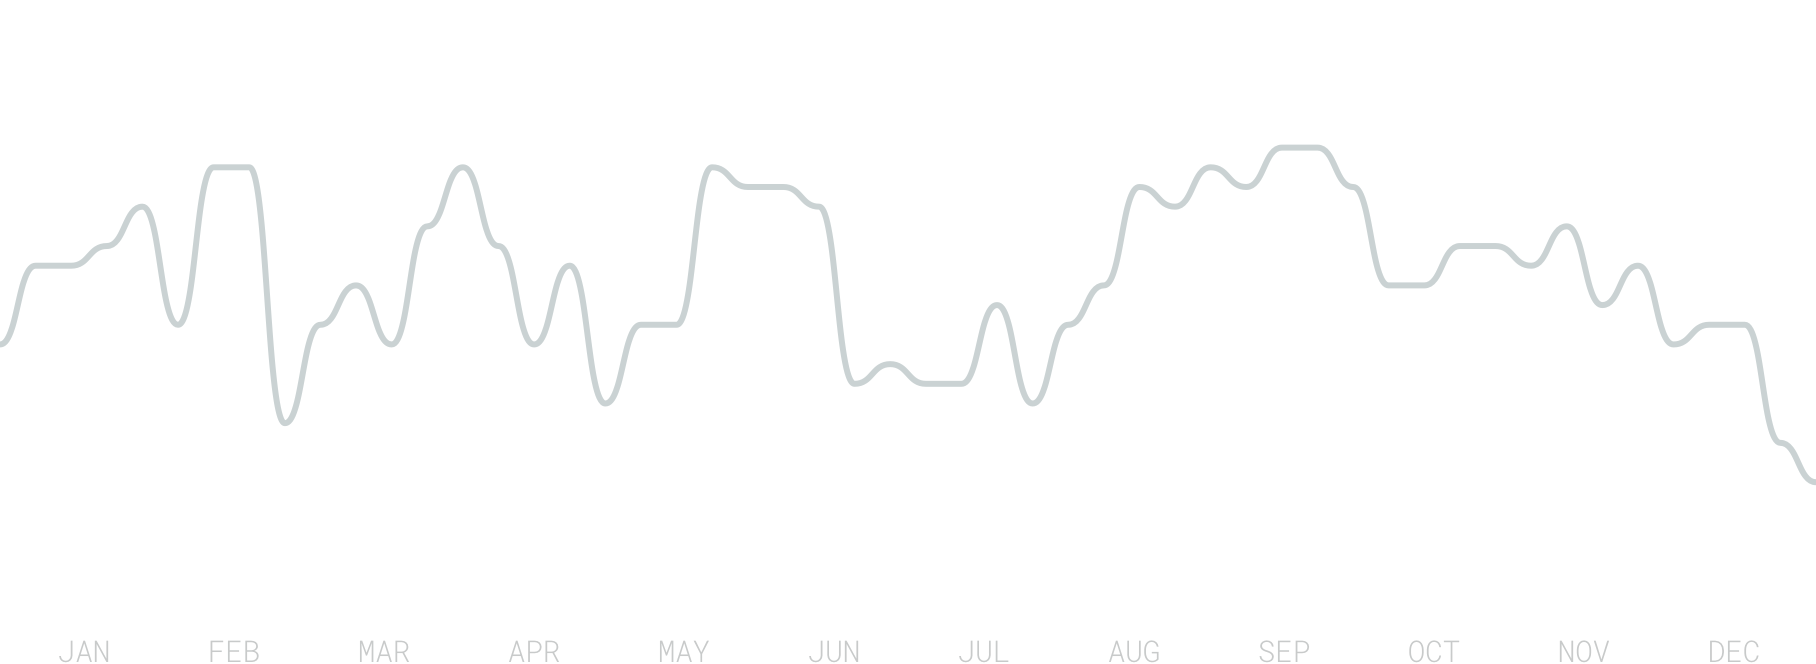
Daily Scores + Monthly average
I rate each day on a scale of 1-5 with 1 being “Very Unhappy” and 5 being “Very Happy”. I evaluate this in the morning of the next day. I’m aware that this method far from perfect (recency bias, etc) and will probably switch to a tool like Felix Krause’s Mood Tracker.
My average happiness score last year was 3.49. March and October were my happiest months, but I don’t have a good explanation for why this is the case.
I keep similar scores for Perceived Stress (1 = Very relaxed, 5 = Very stressed), Perceived Sleep Quality (1 = Hardly slept, 5 = Slept really well) and Perceived Back Pain (1 = No Pain, 10 = Very Painful).
Weekly Average
On average I reported a daily stress level of 2.47. Unsurprisingly, weekends were less stressful (1.69) than work days (2.78). My stress levels also decreased whenever I took a vacation.
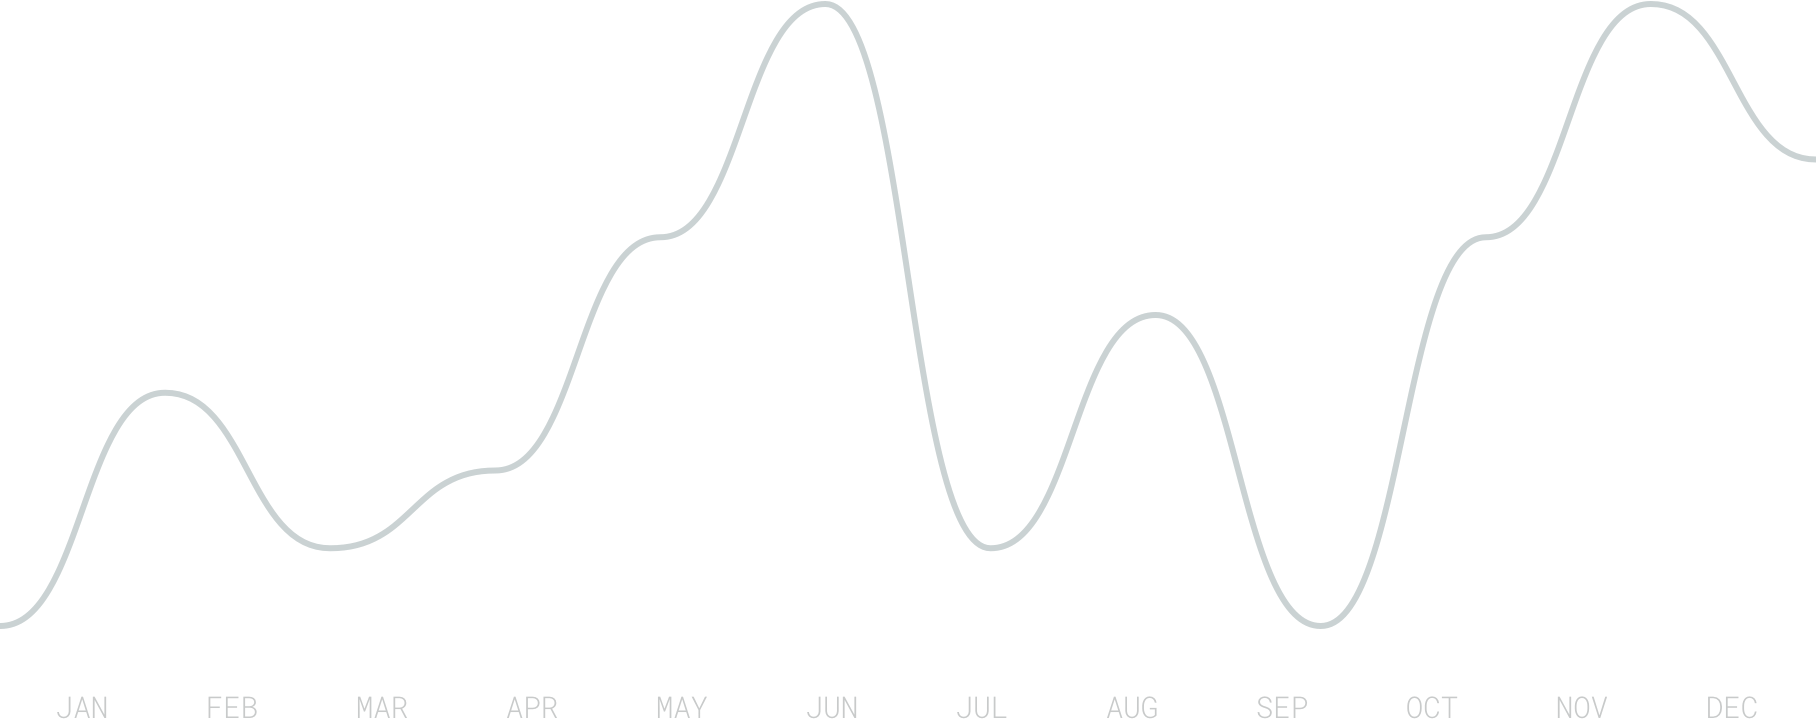
Weekly Average
I spent 2859 hours and 50 minutes asleep last year. That’s 32.64% of the entire year or 7:50 hours per day.
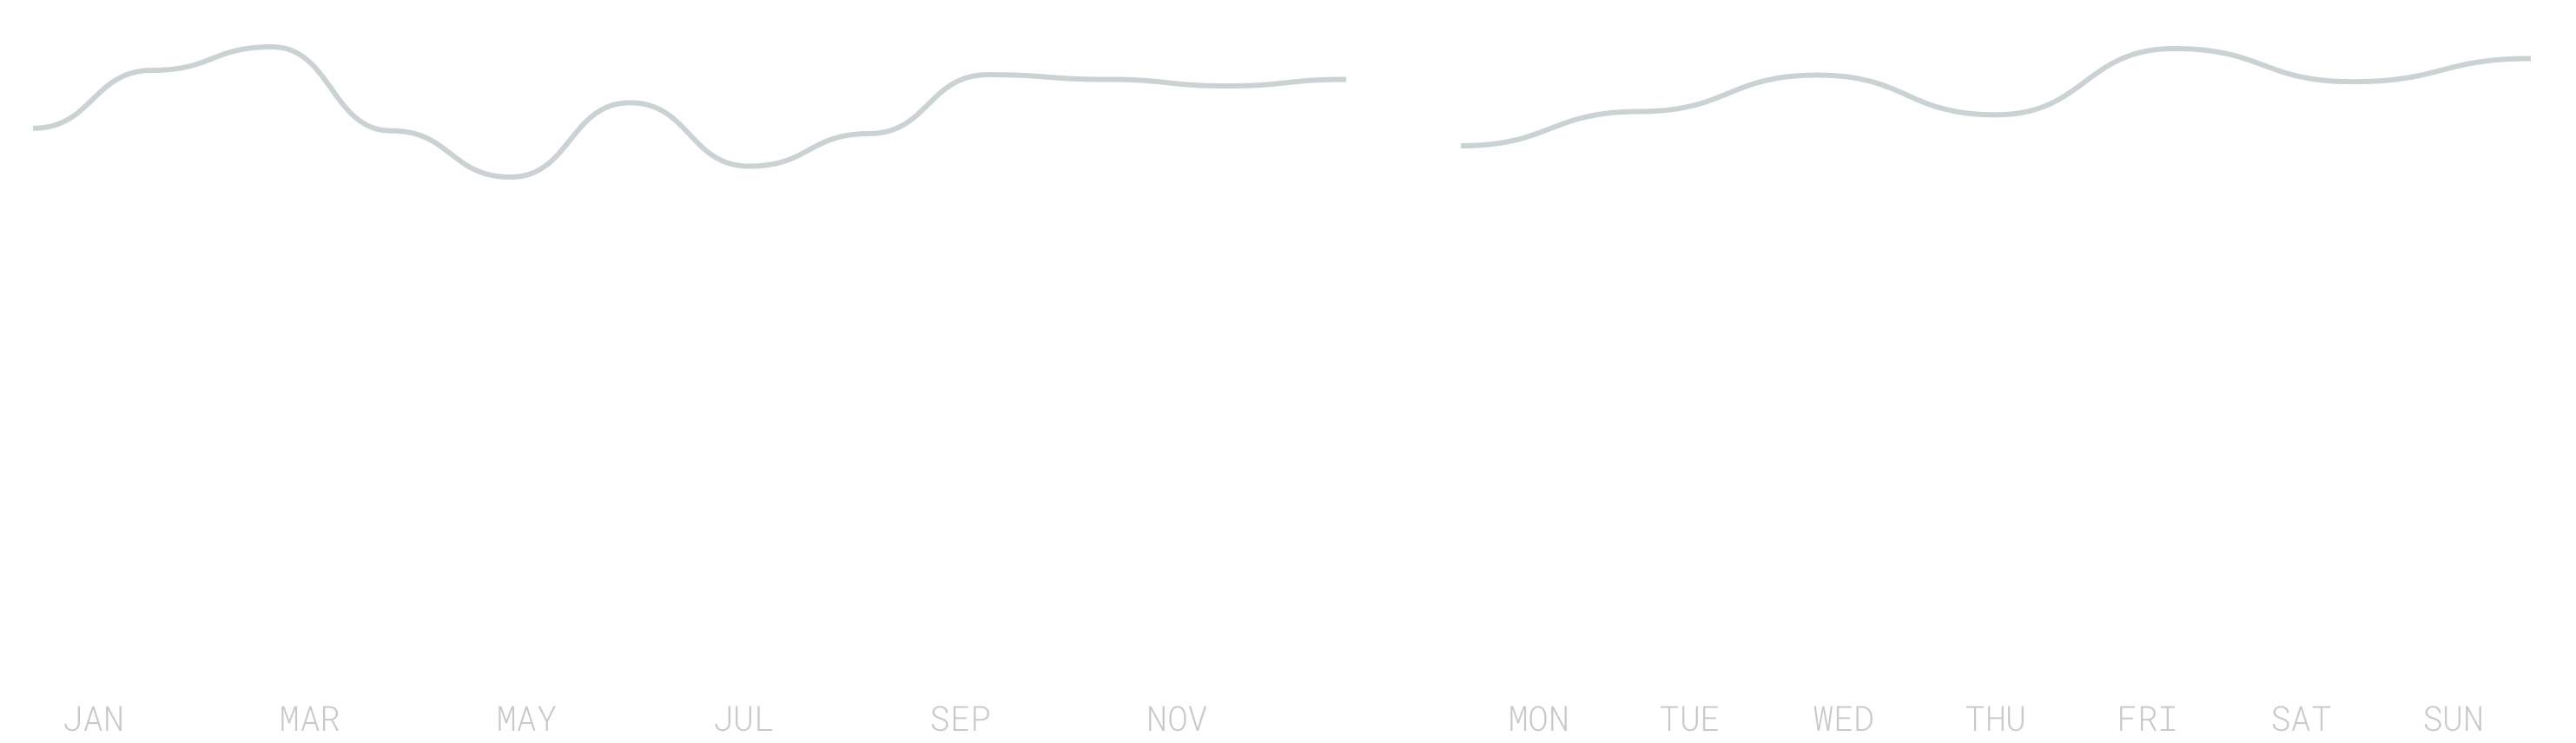
Left: Monthly Average | Right: Weekday Average
I reported an average daily sleep score of 3.68. I slept best in March (4.03) and in nights between Thursday to Friday (3.92). May (3.26) and nights between Sundays and Mondays (3.36) received the lowest perceived sleep quality scores.
Weekly Average
After suffering from chronic back problems for a few years, I started tracking my pain levels in 2017 to get a better understanding of which treatments actually had a positive impact.
In 2018, my average reported daily back pain was 1.45 – down from 4.2 in 2017.
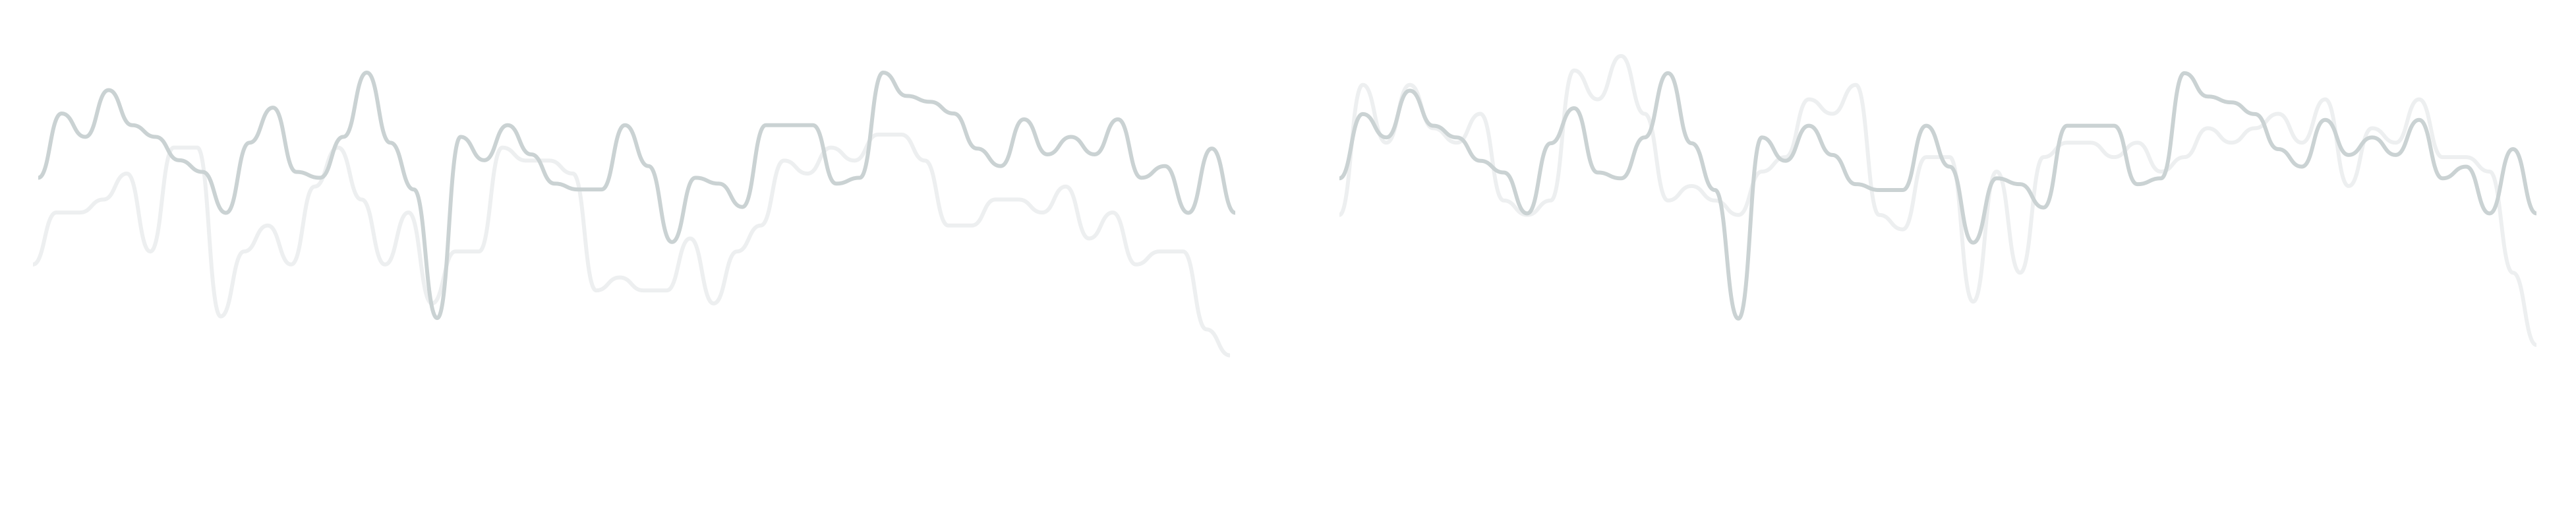
Left: Swim Distance | Right: Stationary Time
I compared my back pain numbers to my swim activities (which seem to have some impact) as well as the time I spent stationary (no physical activity).

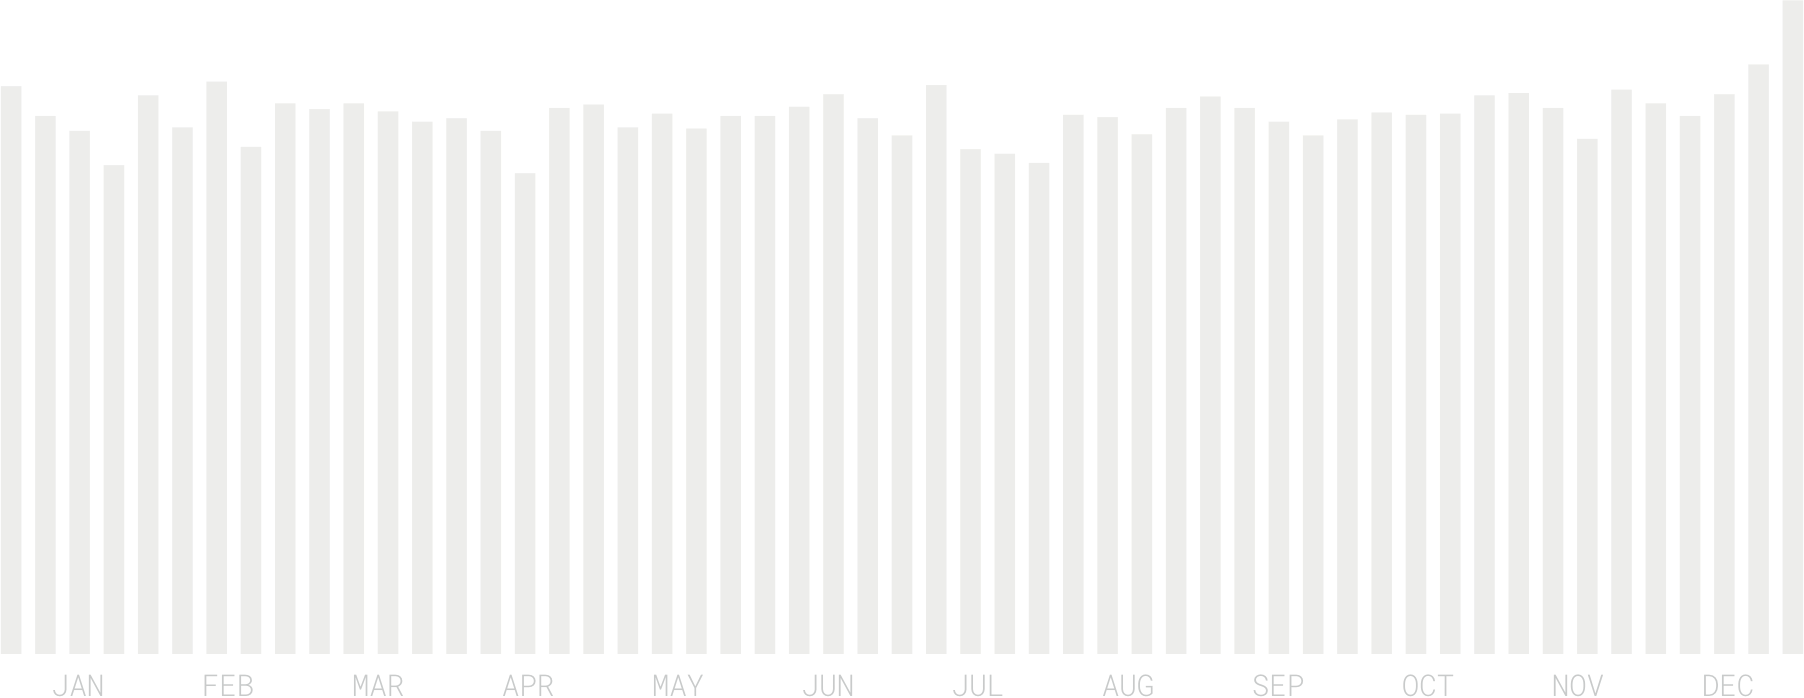
Weekly Duration
I spent 1709 hours in front of my MacBook last year – that’s 19.51% of the entire year.
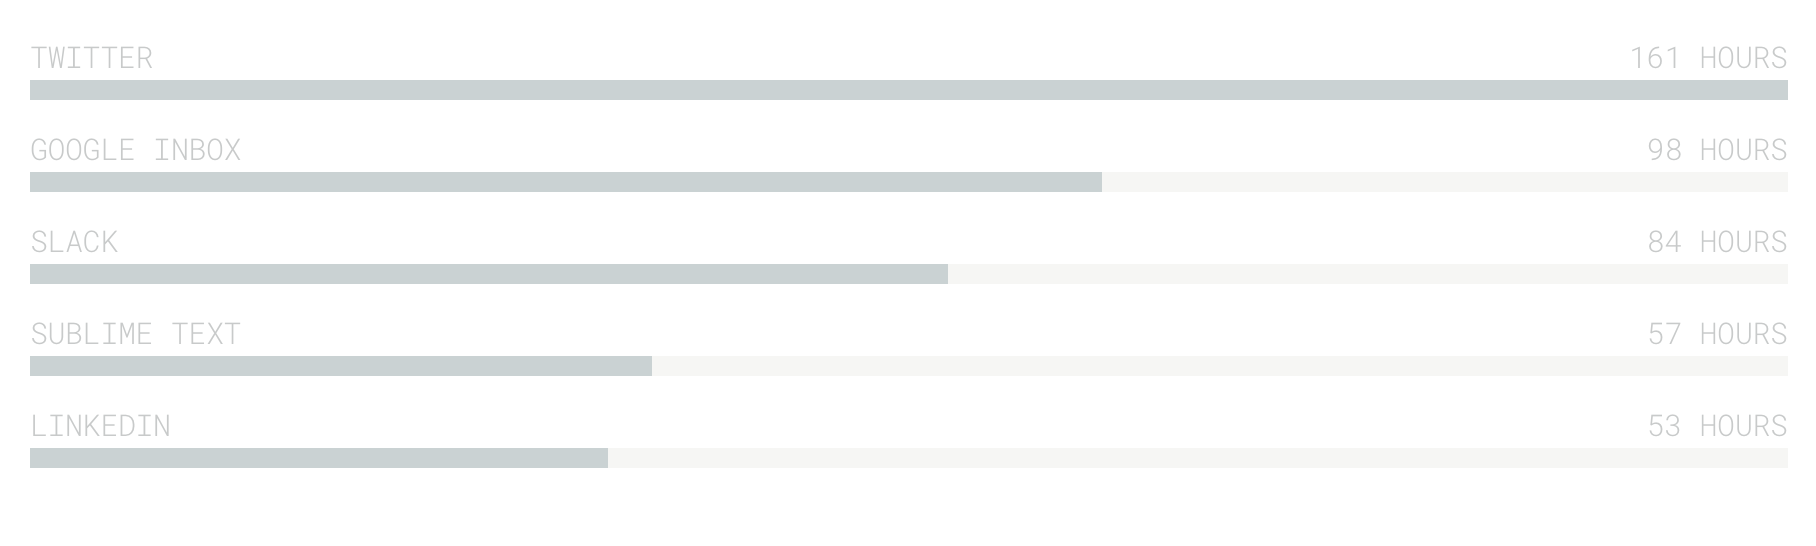
Time spent per application / website
Twitter was by far my most used application in 2018: I spent (wasted?) a total of 161 hours on the platform last year (note that this doesn’t include phone screen time).
98 hours were spent reading and writing emails in Google Inbox – my second most used app last year. I switched to Superhuman at the end of last year and I’m curious if my 2019 data will support the company’s promise of making email faster and more efficient.
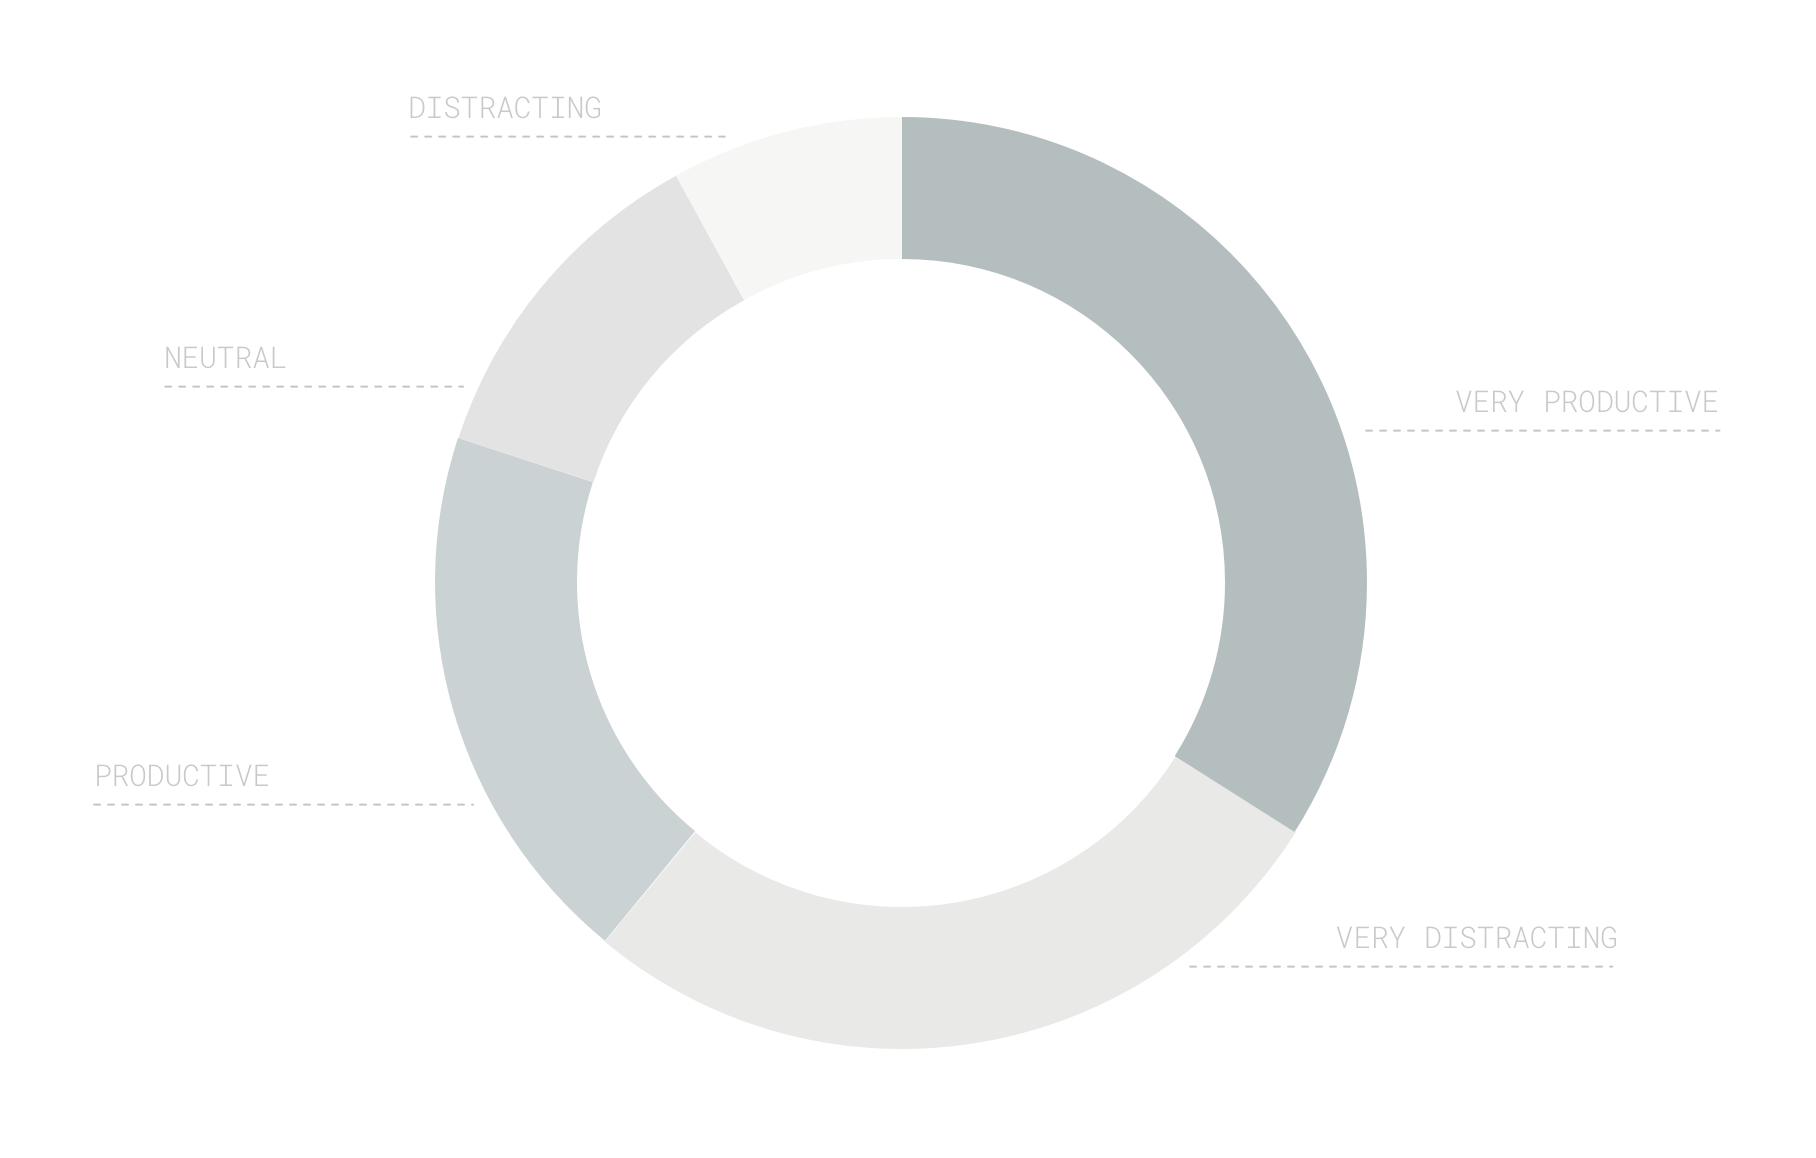
Time spent per category
Every app and website is tagged with a productivity label ranging from Very Productive to Very Unproductive. I spent the majority of the time (907 hours) doing either Very Productive or Productive work. 602 hours were marked as Unproductive or even Very Unproductive.
Average Weekly Productivity Score
Based on the applications’ productivity labels and the time I spent in them, a productivity score between 0 (Very Unproductive) and 100 (Very Productive) is calculated. My overall 2018 productivity score was 56 – down from 62 in 2017.
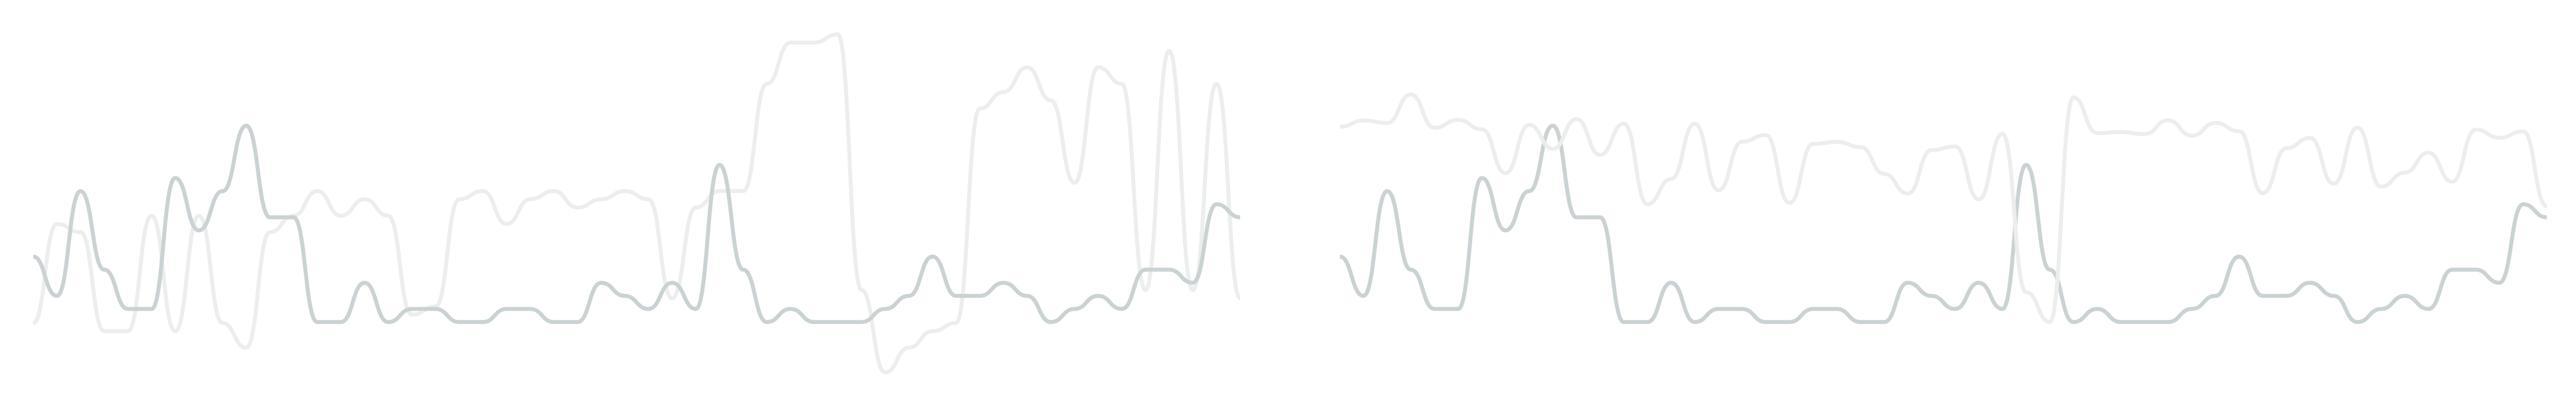
Left: Perceived Stress | Right: Perceived Productivity
My productivity score follows a similar pattern to my perceived stress levels as well as my perceived productivity (which is an additional 1-5 score with which I rate each working day manually).
I worked on this report for 13 hours and 25 minutes 🙂